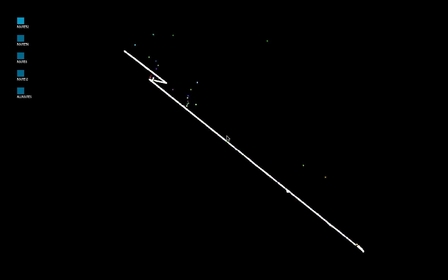
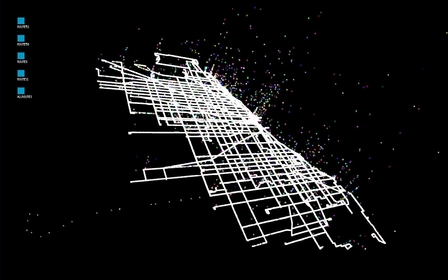
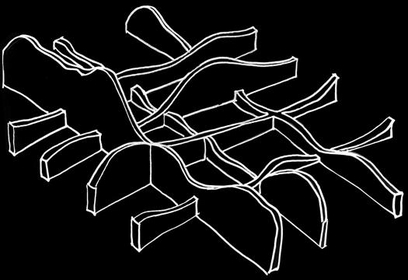
This is a visualization making use of the CTA Bustracker API and is still in development. The current data set is displayed as points, but the intended goal is draw the data as lines extruded in 3D.
The latitude and longitude of every bus in the city is retrieved from the CTA Bustracker service once a minute and compiled into a database. Points are drawn from this information based on the time it takes a bus to travel from one point to the next. A future implementation will use lines instead of points to better understand the plotted information and will assist in highlight trouble spots on the CTA grid. Per-route information will include the bus and driver ID's to better understand the conditions that contribute to large-scale transit problems and whether consistent behavior is due to time, bus, traffic, or driver issues.
| 1 © UIC
| 2 © UIC
| 3 © UIC