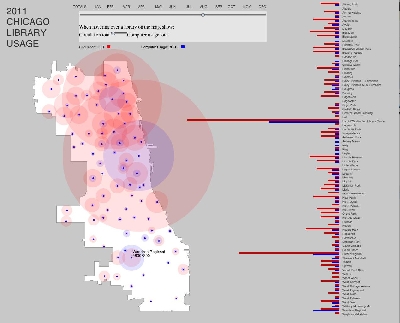
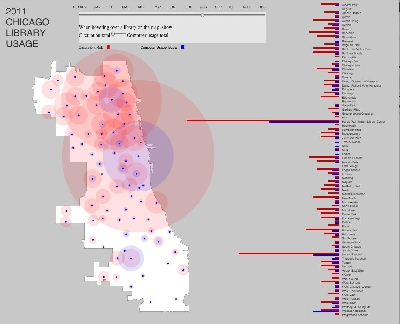
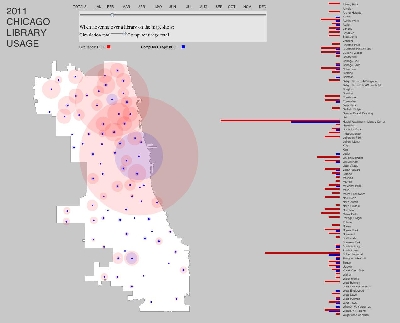
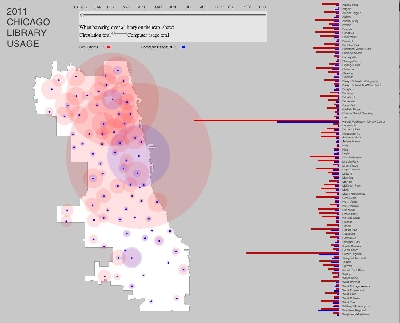
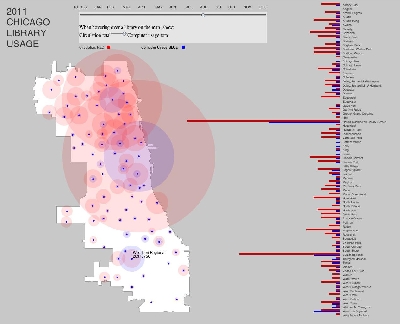
This is a visualization of the circulation and computer usage of the Chicago Public Library at its various branches. Utilizing the recorded statistics for each branch from the City of Chicago data portal, both monthly and yearly totals are viewable, providing an overview of how each branch is used by its patrons. Viewers can compare, in map and graph view, the relative differences and similarities between these two distinctly different types of library usage, in particular comparing the quantities and differences between branches and examining the degree to which different neighborhoods interact with these services. My hope is that this information may help give a better understanding of just what is (measurably) happening within the CPL system over the course of a year.
It should be noted that, for purposes of the graph displays only, the totals represented in bar and circle format for each month have been multiplied by 12 to make up for some the enormous difference between year-total and monthly data. The totals given by hovering over individual libraries are accurate.
| 1 © UIC
| 2 © UIC
| 3 © UIC
| 4 © UIC
| 5 © UIC